Reading a Climate Map Without Treating It Like a Forecast
Reading a climate map reveals a place’s usual seasonal pattern, helps you compare regions fairly and shows when a current forecast is the better tool.
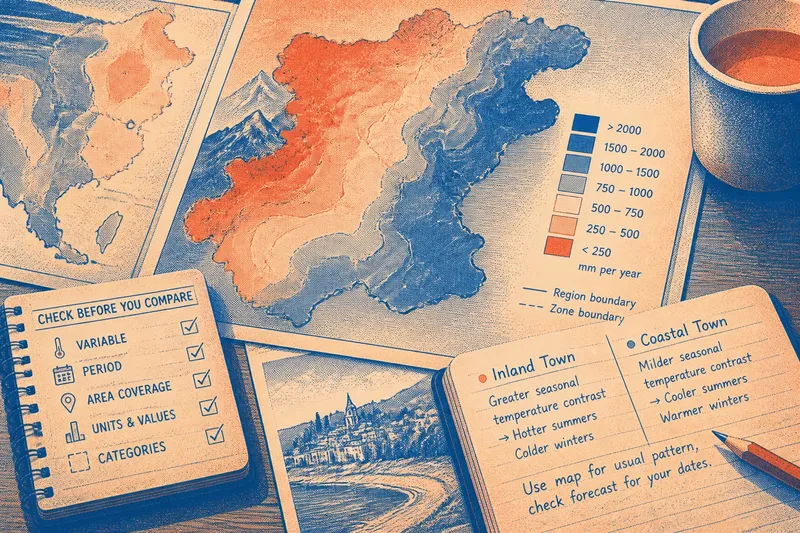
A climate map shows the usual seasonal pattern across a stated area and period; it cannot tell you whether rain will reach a particular street tomorrow. Reading a climate map well starts with matching its information to the question you need to answer.
Climate map purpose
Look at the map title and notes before interpreting its colours. A map may represent average temperature, rainfall, seasonal contrast or a climate classification. Those are different subjects: an annual rainfall map cannot tell you how hot afternoons usually feel.
Check the geographical area and the period represented. A country-wide map can show broad contrasts but may not describe a valley or exposed hillside. If the period is not stated, treat the map cautiously and avoid claims about precise local conditions.
Legend and categories
Read the legend before locating a place. It explains what colours, symbols and boundaries mean. A dark shade might indicate more rainfall on one map and warmer conditions on another, so never transfer a colour’s meaning from one map to the next.
Check the units and whether values are averages, ranges or categories. Continuous shading suggests gradual variation; labelled zones group places for comparison. A boundary may simplify a gradual transition rather than mark a sudden change in local conditions.
- Variable: If the legend names temperature, rainfall or seasonality, use it to answer that specific question; if it is unclear, consult the notes or choose a clearer map.
- Units: If units and value types are stated, interpret the mapped values accordingly; if they are missing, do not infer exact conditions from colour alone.
- Period: If the map identifies the period represented, limit your claim to that period; if it does not, treat the pattern as broad context rather than a precise baseline.
- Area: If the map covers a large region, use it for regional comparisons; if you need a particular site, seek a more local source.
- Categories: If zone definitions are explained, follow them; if boundaries or labels are unexplained, avoid assigning them a meaning.
- Map match: If two maps show the same variable, period and comparable categories, compare their patterns; if any of these differ, check the notes before drawing a conclusion.
Seasonal patterns
After reading the legend, ask what the mapped variable says about the year. A rainfall map may show whether precipitation is concentrated in a season or spread more evenly. A temperature map may reveal seasonal contrast that an annual average conceals.
Similar annual totals can come from different patterns: one place may have frequent light rain, another heavier rain in a shorter season. Likewise, similar annual temperatures can mask very different summers and winters. Look for seasonal layers when timing matters.
Elevation, distance from the coast and terrain can help explain local contrasts, but a broad map may smooth them out. Think of a regional climate zone like a drawer label: useful for grouping, but not a description of every item inside.
Comparing two places
Compare like with like. Check that both maps show the same variable, area type and period, and examine whether their category ranges match. Similar colours do not necessarily represent similar values when the legends differ.
Say you are choosing between an inland town and a coastal town for a visit. Imagine, using invented map readings, that the inland town falls in a category with greater seasonal temperature contrast, while the coastal town falls in a milder category. You can use that contrast to understand their usual seasonal character, but it does not settle what to pack for your dates. Check a current forecast for both towns, then consult local information if the exact site matters.
Climate map or forecast?
What does a climate average tell me?
It describes a recurring pattern for the area and period represented. It does not predict the conditions on a particular date.
Can a climate map tell me if it will rain tomorrow?
No. Use a current weather forecast for near-term rain, temperature and wind. The map provides background about the place and season, not a daily outlook.
Why can nearby places differ?
Coastlines, elevation, terrain and local exposure can shape conditions across short distances. If the exact location matters, use a local map or forecast rather than relying on a broad regional category.
Does one unusual season change the climate category?
One season does not, by itself, define the broader pattern. Check the map’s stated period and compare it with other suitable climate information before interpreting a lasting change.
Choose the right source
Match the source to the decision. Use a climate map to understand usual wet and dry seasons or compare broad regional patterns. Use a forecast to plan for a particular day. For typical conditions at a specific site, look for a local climate resource.
Keep the map’s limits in your wording. If it supports a broad seasonal comparison, describe that pattern as regional; do not turn it into a claim about every street, valley or field. When maps disagree, compare their periods, variables, categories and coverage before deciding whether they answer the same question.
Reading a climate map is most useful when you keep its area and period attached to every conclusion. State what the map can support, then switch to a forecast or local source when your decision depends on a specific place or date.